
No time to waste, yet everything to gain...
When tasks in an educator’s day can take them away from their ultimate joy, we need to take stock. See the insights and designs that let educators interface less with administrators and more with their kiddos!
intro
A non-profit designed to teach underprivileged kids to read by grade 3 was not designed to monitor its own operations and determine how to continuously improve. That’s where the help of a UX researcher comes in handy to find the most time-consuming pain points, and designs new platforms to complete the mission.
Designed an educator resource site that reduced Time-on-Task by almost 50%. I used diary studies, user interviews and usability testing to gather data. Key deliverables were Time-on-Task vs. Favorability study, heuristic evaluation, wireframes, prototypes and a full list of requirements for future development.
the tldr:
Meet springboard collaborative!
Springboard Collaborative (SBC) is an nonprofit striving to bridge the literacy gap in grades K-3. Post Covid, realities in the educational space placed great pressure on nonprofits serving school districts to ‘cut costs’. But, where to cut while keeping or improving the UX?
I was tasked with improving and streamlining the experience of the educator, an integral part of the “secret sauce” at SBC. I had just begun gathering a picture of the user journey but there were many holes to fill. This is the study of one of those touch points and how we ultimately improved AND established a process to monitor and continue improving.
the problem
“We need to cut programming costs, but not at the expense of our mission of helping disenfranchised youth gain literacy.”
-Chief Product Officer
THE GOAL
Cutting costs by 35%
Financially, the goal was clear. After finance and sales team analyzed competing organizations and the depletion of COVID era funding, the org needed to reduce costs.


THE Hurdle
Hard to quantify
Need to know how much time is spent using a digital products? That’s easy.
How do you quantify Time on Task for actions taken offline? User logs won’t help. We need another method.
the research
"The biggest problem is not knowing what you don’t know".
-Samuel Langhorne Clemens
WHAT I learned
Choosing the Methods
I Need BOTH Magnitudes and Sentiment
I need both “quant” and “qual”. I was asked to carry out a survey, but I suggested that we conduct a diary study. This would prove crucial for gaining insights into experience, ACCURATE Time on Task (ToT), and even how educators were conducting workarounds to current designs when their efficacy failed—which is also invaluable for later drafting solutions! Surveys can’t do this.
After gaining some clarity on the questions above from the SMEs, I could now conduct a diary study with close collaboration from our Partner Success Team—the team closest to programming. Data showed:
-
of all administrative ToT was spent looking for materials in the Educator Resource Site (ERS)! It was also tied for the most repeated task. 6 of 14 touch points required educators to interact with it.
-
was the average time to find a resource on the ERS. An eternity, even for a content oriented page like the ERS.
-
The modal response for: “How helpful was the [ERS] in helping you find the resources you needed throughout your session?
(Likert scale of 1 to 5, 1 = lowest) -
Running a word cloud of diary study responses, this was the 2nd most frequent input. 1st was “Lesson Plans”, which at this point is not very useful--but will become so later!
The main audience for insights was the org’s senior management. They needed a clear indicator of how to focus the roadmap for implementing our goals.
This chart visually laid bare where to roll up our sleeves.
Click image to view detailSo what now?
It’s now time to build and test…
The place where educators went to get their digital teaching materials was VERY deficient! I now needed to commence a full redesign initiative.
But, I just had quantitative clues that the Educator Resource Platform (ERP) needed help. But why? Is it a cosmetic fix? Is this a full IA revamp? Time for a site audit!
Stepping back
Task inventory and ‘Not-all-tasks-are-good’
I needed an inventory of tasks that educators were engaging in. I leveraged “on the ground” teammates to gain perspective on what educators were doing.
I created two “buckets” to classify tasks: Administrative and Impact. The former would surely be less desirable than the latter…


Teamwork is key
A UX Researcher is NOT an island!
I leveraged insights from content designers, partner success, and leadership, to fully understand why we were asking educators to engage in the tasks they were asked to complete.
Internal SMEs would prove indispensable if I was going to ask the right questions…
Visually telling the story
The image that made decisions “easy”

the solution
“I don’t know... It’s like I see these documents so often but I’m never sure where anything is.”
-Educator undergoing SBC programming for the 3rd time
look and feel
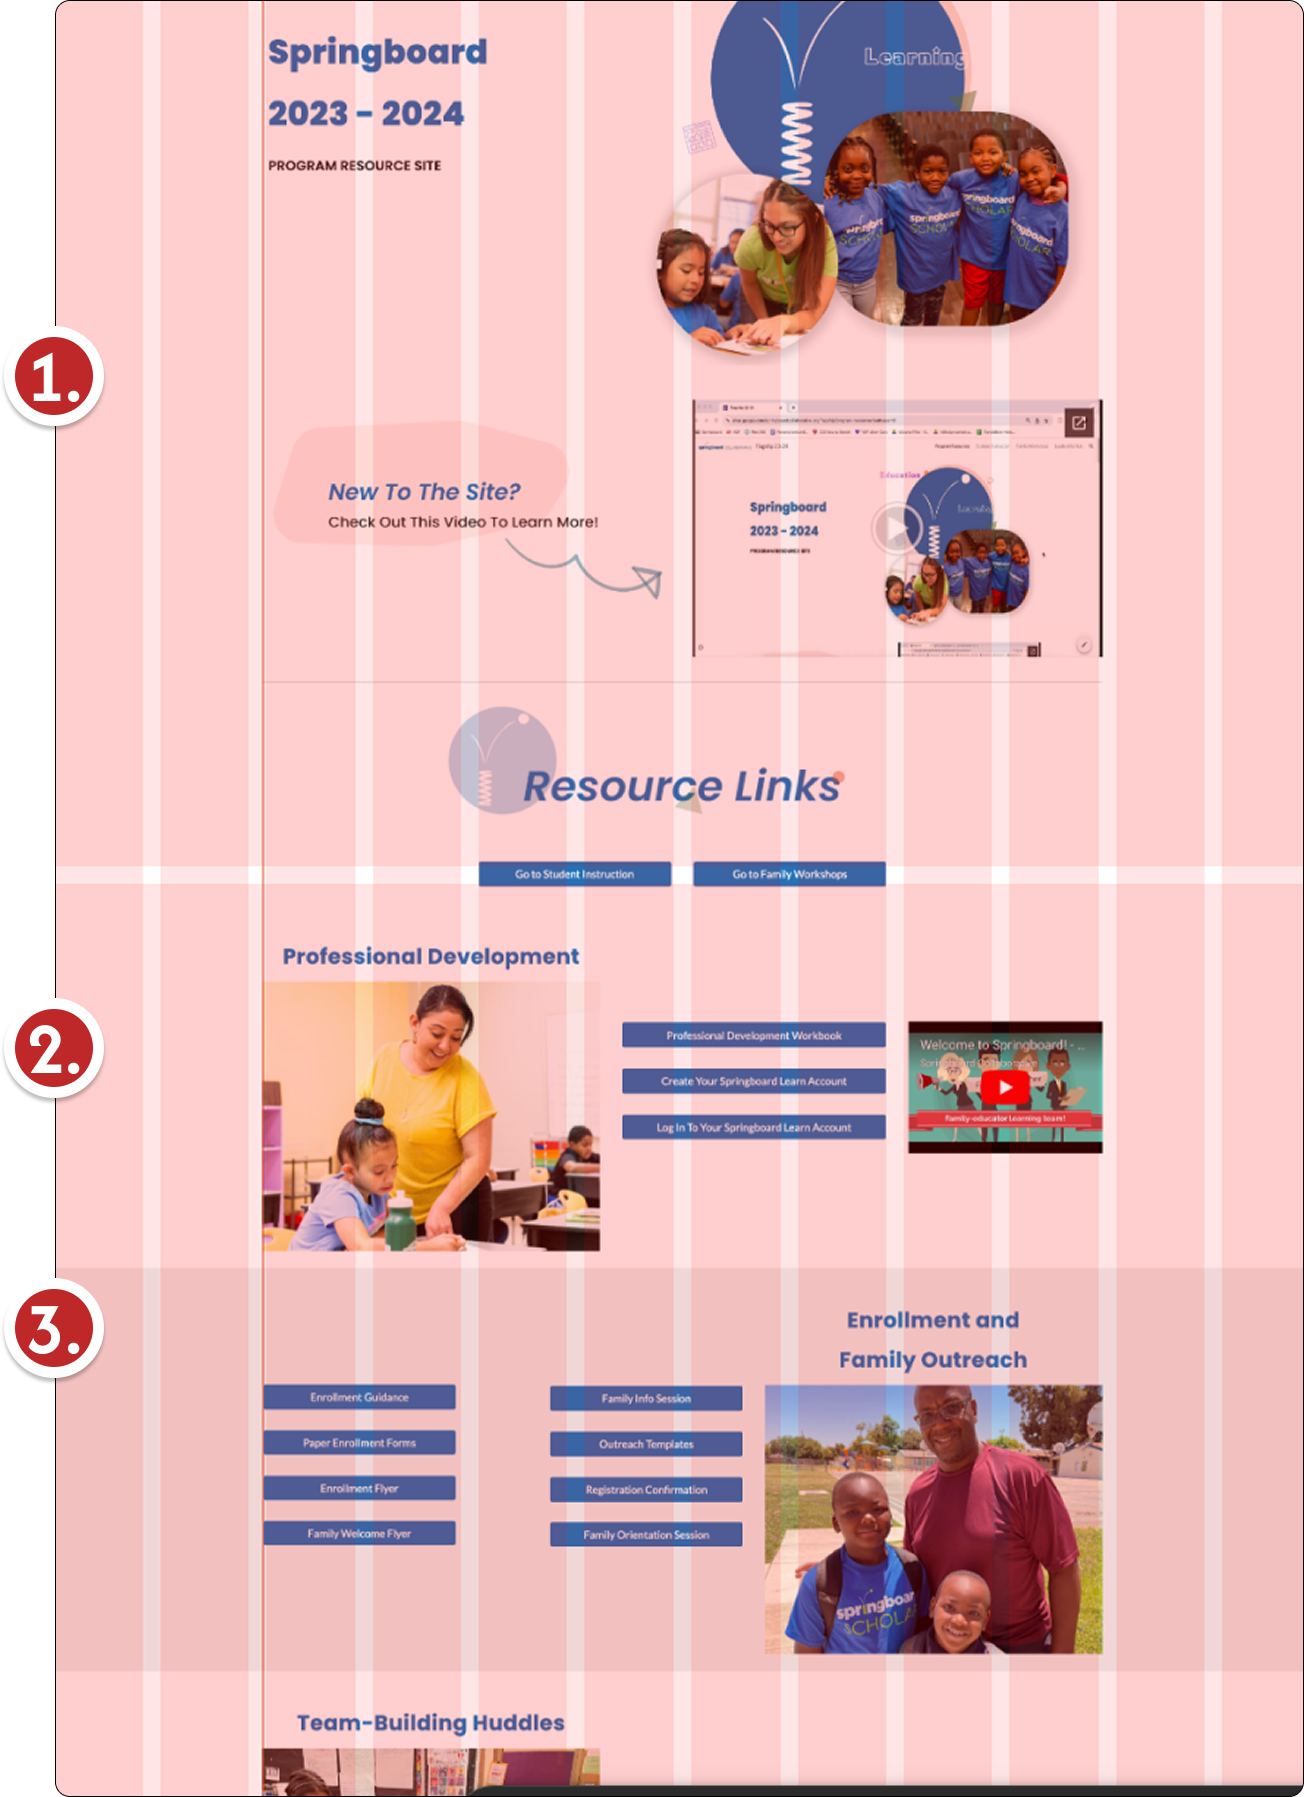
OK, so first, a good heuristics and site audit! No need for a usability test just yet! There were clear issues with the site upon inspection. See below.
On Figma I overlayed a (12) columnar grid on the site and it became clear that elements were not placed with much care for layout and alignment.This exercise revealed:
-
No adherence to basic layout conventions and design best practices. Little adherence to a grid or alignment.
Issue: Visually and mentally taxing to the visitor -
CTAs were not clear. Abuse of a “button” as an interaction element.
Issue: Visually and mentally taxing to the visitor -
Section hierarchy followed the order of the “FELA” method, and potentially not according to frequency of use of each component of the method, where the most common should be placed at the top of the home page.
Issue: Not following user mental models and possibly pointing at fundamental IA issues. -
not depicted in the screen shot above, the destination pages were massive and contained a lot of sections, thus, educators ‘skimmed’ many pages to find resources.
Issue: Content not parsed correctly and again, suggesting IA issues.
A SOLUTION WILL need MORE TESTING!
I need to find tripping hazards
Before considering a solution, I conducted usability tests to uncover specific issues with the current design. The diary study helped point me in the right direction for what to fix. The Usability Tests would uncover why it’s broken.
Click image to view detailWhat I learned
Many assumptions were fell short!
The usability tests revealed that the page flows, sections and generally the IA would need to be revamped. But more importantly, this would also require that we reimagine how we served content.
The lion’s share of the time wasted in searching for specific materials was at the target page. These consisted of PDF documents that were often over 100 pages long.
-
actually recalled the FELA* method. Yet, the one that did, could not describe it properly. They did not know the order of its phases.
Takeaway: Ordering the site by the FELA method, was NOT the way of organizing sections on the home page. -
or 11/16 tasks were completed correctly and 3 false positives (wrong material found with participants reporting high confidence finding correct materials!)
Takeaway: Size of destination page and navigation is not clear. Content reduction, modularization and IA exercises needed. -
of the click-backs were at the destination page level. 80% of the time was spent at the destination page. CONTENT OVERLOAD!
Takeaways: participant was arriving to the end of their navigation to learn that they were in the wrong section of the site–requiring a lot of time. We need to modularize content and improve our IA. -
little correlation in program seniority and performance. N=4 is small but no obvious difference in performance.
Takeaway: Site is of poor design/inconsistent. Users couldn’t learn flows. Potentially too many clicks in order to reach the destination page. Designs must be limited to “< 3 clicks to target.”
*FELA Method: Family Educator Learning Accelerator. It is a series of steps taken between families, educators and students that help all interact more effectively.It became likely that my task was more than just layout and aesthetic improvements. We would need to modify terminology, content structures and Information Architecture. Essentially, a full revamp. A diary study and usability studies revealed that:
DESIGN DECISIONS
What research was revealing
-
During the diary study, I learned that educators MOST used the site to find student instruction materials, followed closely by family interaction resources. These needed to be prominent (above the fold?) in the redesign.
-
The links that finally led to the destination page were ‘titled’ in the format above. There was no correspondence to ‘lesson plans’. Recall that that was the most common word/expression in our diary study word cloud… This was a clue to how we may need to structure our content: Structure our content as educators structure their teaching.
-
Diary studies revealed what is almost inevitable in design: If your design is inadequate, people, will often “satisfice”until abandoning, meaning that they start to find workarounds and then quit. There was in fact a spreadsheet circulating that served as the workaround. They said: “The worksheet shows my progress, I need to know where I’m at” A progress visual and a grid design for the units and lessons may ultimately be integrated.
First thing’s first
We needed to understand the most common use cases
I synthesized my findings, got approval for a card sort exercise and workshopped some wire-frame candidates with my team until settling on this initial design.
It included the grid-like interface that would allow educators to get an overview of their past, current and upcoming lessons. It also prominently displayed “Family Engagement” materials, as this was very frequently why educators would return to the site.
Click image to view detailThe most important feature here is that the two most commonly visited parts of the site were revealed by the diary study to be Student Instruction and Family Engagement. These were placed prominently to appear above the fold. It included a first attempt at a grid layout for lessons to mimic educators’ mental models.After arriving at this wireframe, we then proceeded to mock up and test the following iteration:
There were some ‘mishaps’ where the educator was choosing the wrong grade level and confusion regarding what this page contained. I made some small ‘tweaks’ to the design and arrived at this prototype for final user testing.
A final (N=6, tasks= 4/ea.) prototype testing lead to:
-
of tasks completed accurately, where all reported high confidence in finding proper materials.
However, 3 of 24 tasks not properly completed and all reported proper completion…
There is proper use of terminology, the content is quickly identifiable, CTAs are clear and affordance of navigation elements comes through strongly. -
No participant went down a false path
Only two participants performed click-backs on a task but eventually pushed on and found they were on the right track. -
and 7 seconds--the average time for finding the proper material. This is a better than 50% decrease in time navigating and identifying material.
It was better than expected. The portion of navigation that saw greatest improvement was time on destination page--CONTENT DESIGNERS’ REDESIGN IS CRITICAL! -
is the change in mode responses between old and new sites when asked: “How helpful was the ERS in helping you find the resources you needed” with the lowest score being 4.
Although not yet just right, this was ample evidence that this resource prototype was a step in the right direction.
*FELA Method: Family Educator Learning Accelerator. It is a series of steps taken between families, educators and students that help all interact more effectively.the takeaway
“I’m sorry in advance. I know I will be wrong, but I don’t know about what…”
-Ronald Ricardo (yours truly)
be a thought partner
While discussing a method for fleshing out our educator user journey, management suggested a survey. We had a walk-through on the reasoning and I gathered that they wanted a strong Time on Task baseline, but also a strong sense of ‘what [educators] actually did, heard, saw and thought’. There was an emphasis in filling in the gaps of our journey maps, and I sensed a desire to bring all design teams up to speed on the full user experience.
I suggested that we should invest a little more and conduct a diary study with a smaller, carefully curated participant sample, rather than a large sample’s random approach. The cost increased ~$1K, and our budget easily supported the difference.
I said: “Even with open-ended survey questions, I can’t ‘dig’ like I can with an interactive diary study where I chat with a participant for 5 to 10 weeks”. I cautioned against a survey that would take place maybe 13 weeks from a task’s completion, then hope the participant recollects details such as time and ultimate experience resolving tasks. The fact that internal SMEs identified 14 touch points and 33 distinct tasks, necessitated a survey with at least 2 data points per task. A 66 question survey for a $25 compensation would lead to survey fatigue or abandoned surveys. I am glad management and I both regarded each other as thought partners, arriving at an optimal method, yielding rich data.
a word of caution
Once the designs were submitted and all the requirements approved, I included a recommendation for a Ways-of-Working design flow for our team. It included designating a team to monitor the performance of our deployed designs with the clear establishment of KPIs to track. This unfortunately was not adopted. There were concerns that our designs would ‘never end’ and that staff would be bogged down by an ‘analysis paralysis’ and spreading the team too thin. This made sense and I suspect that this may be the sentiment of teams everywhere. The linear design that you just witnessed above could be considered a bit naive. I am proud of the design that I submitted, and I stand by it given the info that I had. IT WILL BE PROVEN WRONG to some extent. There are aspects that will fail, like any design.
Another concern I had was that the ERS is one of three different systems that educators must interact with. In my deliverable, I suggested investigating how to merge all these systems, thereby putting the existence of the ERS as a standalone platform into question. I left this project knowing that there was still work to be done, but confident improvements had been made.
other case studies

A story of a startup not letting vacation planning to chance.
This story began with a founder wanting to find out what to do when Friday rolled around. Research revealed that, if he faced a challenge, it paled in comparison to those traveling abroad.

“Well, frankly, you’re the worst, and it’s not close.”
I put on my UX Researcher hat when talking to some clients at a trade finance bank. Asking one of them: “So, how does this bank stack up versus its competition?”